Wednesday, April 1, 2015

CLOUD COMPUTING MEETS BUSINESS INTELLIGENCE

Moore’s law which states that processor speeds and overall processing power for computers will double every year and technology will get cheaper. This evolves the trends of mobile computing, social networking and cloud computing.
These days business intelligence (BI) is a top enterprise application priority while cloud computing is the new buzz on infrastructure side. Together these two concepts form a cloud hosted BI which makes the business data more accessible than ever before. So, cloud business intelligence applications will be hosted on a virtual network like the Internet. Employees can access the dashboards consisting of reports using numerous browsers. Hence, when cloud meets business intelligence information to the business users, right information is accessible to the users at the right time via the cloud.

TERADATA

Teradata believes when the world gets smaller, the data gets bigger. The objective of Teradata is to facilitate the companies is to unify their information and discover the things that matter to them. It solve the most pressing business problems by bringing together highly scalable hardware, a world-class parallel database, the industry’s only comprehensive in-database data mining technology and over 30 years of Teradata data warehousing expertise, including:

·      Maximizing your ROI and getting the most out of intelligence hidden in your data warehouse
·        Reducing model development cycle time with faster delivery of analytic insights
·        Obtaining the scalability you need to build analytical models

TERADATA ASTER CLOUD EDITION
It offers big data analytics on demand by bringing in the flexibility and agility of cloud computing. The massive parallel analytics engine stores and processes big data to offer performance and scalability. This edition takes full advantage of scalability and elasticity of cloud computing.


Benefits:
·        Start analytic application projects quickly
·        Scale easily and incrementally to many terabytes of data without disruption
·        Gain deeper insights into multi-structured data using Teradata Aster’s patented SQL-MapReduce®

Customer Stories

Coco Cola has a tremendous volume of internal data. To use this information to drive business, relevant information has to be integrated through a series of master management processes. The Teradata Enterprise Data Warehouse solution manages all of this internal data. Storage and processing power of the Teradata cloud is being used to handle Big Data. Coco Cola is investing in cloud computing, virtualization as well as distributed approaches like MapReduce.

Comcast
 dss


Comcast the world’s leading media, entertainment and communications companies. It serves 24 million cable subscribers, runs 300 TV channels including 150 HD and provides 150,000 online entertainment choices. Comcast claims that Teradata saves them time in design phase where requirement input is lacking. Under the supervision of Teradata, Comcast decided to re-architect data warehouse from scratch. With the holistic view of data produced and consumed it provides a bigger picture of future.
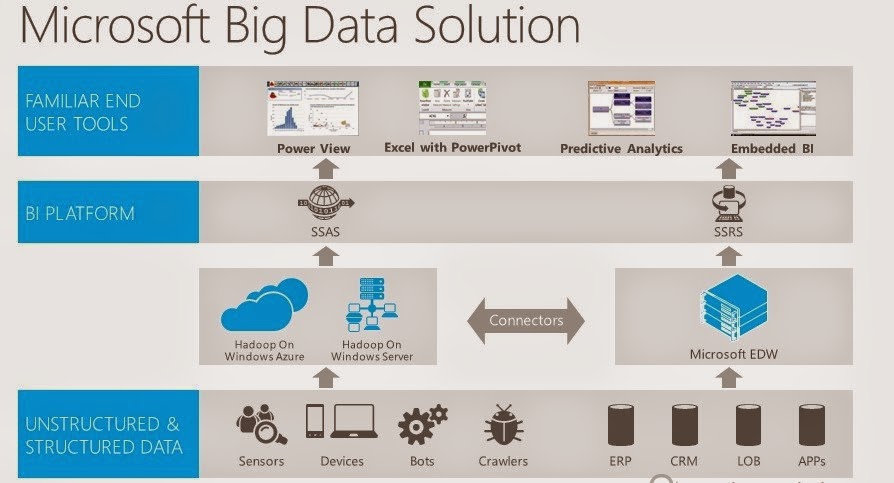

MICROSOFT AZURE BI


Business intelligence tool combined with an advanced cloud storage service is Microsoft’s latest technology for analytics that is helping small businesses grow their data analytics system. Cost effective wise, small businesses can use an affordable yet powerful cloud service that is scalable. The user only pays for the service actually used for their business. As the organization runs their business intelligence tool using the Microsoft Azure, highly scalable results are attainable that allows one to pay only per minute of usage. Microsoft Azure offers an economic cloud storage facility, small businesses are able to become as competitive as bigger enterprises because they can enjoy the same benefits.

Customer Stories

ABB


ABB being a global company wanted an application that the managers and business analysts could utilize to identify market opportunities and address challenges geographically. ABB wanted to move to the cloud business intelligence to query data faster. Using the Microsoft Azure they have gained higher velocity in running data apps within a highly reliable and manageable cloud infrastructure.

Power BI includes four key tools used by ABB:
·        Power Query to find and access data
·        Power Pivot to create data models for analysis
·        Power View to produce highly visual reports
·        Power Map to integrate data with 3-D geo-spatial maps

 AMD


AMD produces technologies such as semiconductors that power personal computers, mobile devices, game consoles, and cloud servers. Being an international company with a global customer base a presence in multiple markets, the company needed better tools for monitoring business processes. Their data warehouse team wanted to make the solution to include faster reporting and a single source of truth for operational data. 

Thursday, March 5, 2015

Data Presentation and Visualization

DATA VISUALIZATION is the presentation of data in graphical format. The primary goal of data visualization is to communicate information clearly and effectively to users of the dashboard or reports as spreadsheets are hard to visualize. Data visualizations help people see trends that were not obvious before. Popular data visualization diagrams are Bar charts, Pie chart, Line chart, Tree Map, Bubble chart, Scatter chart.
HOW TO DECIDE WHICH VISUAL IS THE BEST?
One of the biggest challenges for non technical and business users in producing data visualizations is deciding which visual should be used to represent the data accurately.
  1. Understand the message to communicate i.e. relationship, comparison, composition or distribution
  2. Experiment with the available arrangements
  3. Finalize the best arrangement

RETAIL SALES OF ONLINE STORE – GROSS SALES
An online retail store generally collects data about its customers and where are they coming from i.e. platforms and websites. I want to depict the sum of gross sales by platforms. Online platforms can be broadly classified into PC, Mobile and Tablets. As depicted below, two types of graphs can be used bar charts and circular charts. My recommendation is to visualize using circular chart as it gives us a clear overview. Also various bar charts depicting gross sales by quarters can be shown.


Conversion rate can also be calculated based on the granularity of data i.e. % of Visits that converts to Orders. It is one of the most important metric for our business because the ultimate goal of making a good website, offer amazing products, attracting customers to our website would only work when we will be able to get the customers to purchase from our website, which would in turn generate more revenue and profits for us.  Source: Self-Created
FINANCIAL SERVICES – Accounts Receivable Graph
Below is the visual representation of the financial data of an organization. There can be multiple ways to display information about the total amount receivable over a period of time. It shows how much customers owe you over a period of time.
  1. The information can be represented in a tabular format displaying amount receivables by time by customer where column1 will contain values for amount receivable and column 2 will contain the customer names for a particular month.
  2. My recommendation is to represent this in the form of pie chart as it will display how much each customer owes and also the relative comparison with other customers can also be easily obtained. It gives a good overview at a high level of the receivable report for the organization.  


HUMAN RESOURCES DEPARTMENT – COMPANY EMPLOYEE PROFILES
To track the demographics of the employees in an organization numerous visualizations can be shown as shown below in the form of a bar graph or table. My recommendation is to depict using bar graph as it is very simple and easy to comprehend report as compared to the tabular format.


REFERENCES

Wednesday, February 18, 2015

DATA WAREHOUSE: CURRENT SCENARIO & CHALLENGES AHEAD


Data generated by organizations and user interaction can be broadly classified into 3 major categories:-
Structured data as the name suggests is information that is stored in fixed fields within a record or file. Relational databases and spreadsheets are examples of structured data.  Usually displayed in named columns and rows as it is very easy to order and process such data.
Unstructured data as the name suggests is not organized and has no identifiable internal structure. Popular examples of unstructured data are emails, audio, video, social media posts, emails and many more. Usually they are in this category as the content in these files are unorganized.
Semi Structured data is one which does not conform to the formal structure of relational databases, but contains tags to define hierarchies of records and fields within data. Popular examples include JSON and XML format.
As discussed above, the fundamental difference between structured and unstructured data is that structured data is organized in a highly manageable format. Unstructured is raw and unorganized. Hence, mining through the unstructured data can be costly and problematic. On the other hand, mining through structured data is relatively simplistic and straightforward. Unstructured data is growing at a very fast pace because rich data types like pictures, music, movies provides superior user experience as compared to just text. Structured Query Language (SQL) is the programming language created for managing and querying structured data whereas Hadoop is used for data analysis of unstructured data.
In today’s business world, structured data is generated through transactions and unstructured data represents communications between people and documents. Generally email is considered as structured data since it is indexed on date, sender, recipient and subject. But, it is still unstructured data as the body of the email remains unstructured.  Hence, classified as semi- structured.
Volume of Structures, unstructured and semi structured data

As depicted by the graph, the volume of unstructured data is continuously increasing at a very fast pace and has quadrupled from 2008 to 2015. The major contributing factors for this rapid increase is the increase in usage of social media and mobile devices. Semi- structured and structured data has also increased in volume but not as much as unstructured data.


Data warehouseIt is a single logical large repository of data generated from within the company. It integrates data from different sources to create a single knowledge base. Data warehouses are designed to facilitate reporting, decision support and analysis to guide the management’s decisions about the company. Historical data is kept within the data warehouse and this data is non-volatile. Generally a data warehouse is built from the transactional data and is used specifically for query and analysis. It is time variant as data warehouse is only accurate and valid for a specific period in time or interval.
Limitations of Data warehousing
Complexity in integration of data from disparate sources is a challenge -there are several cases when there are disagreements within the organization about data that has to be integrated. For example different departments may have different views of data and there can be a never ending debate on who has the correct view of data.
Unstructured data can’t be stored in its raw form in typical data warehouses- The nature of unstructured data makes it hard to search, retrieve and analyze this data and directly integrating this unstructured data with structured data is a challenge. Advanced techniques like natural language processing, text tagging is required to convert unstructured to structured data.
Required data not captured in transactional systems i.e. Lack of data and poor quality - data is loaded into the data warehouse from the transactional systems, therefore some attributes might not be captured in transactional systems which might be very useful for data warehouses
Inflexible to changing business requirements/questions/data types- a lot of time is spent on ETL process and once data is loaded in the data warehouse, it is difficult and costly to answers the questions that may arise over time and correct errors in the ETL process. Also, data type changes in source systems like ranges, schema are difficult to accommodate in later stages.
High demand for resources – the data warehouse is a huge repository and hence requires large storage capacity. The amount of data that can be stored is restricted by the storage capacity of data warehouse.
Future of Data warehousing with the advent of Big Data
Data warehouses were originally built to organize data to discover and analyze historical trends. They were built to handle structured data from ERP systems and not the unstructured data generated from social media like Facebook, Twitter, Mobile devices, web traffic etc. But, now due to data explosion i.e. more data is being generated in more places by more number of people and applications at a very fast pace. With the advent of Big data, mobility, cloud, NoSQL, the data warehouses face additional challenges. The below mentioned points pose a challenge to the traditional data warehouses:-
  • Explosion in real time analysis
  • Accessibility of Big Data streams
  • Multi format multi type of data
  • Scaling across different geographies
This does not mean that Big data will replace data warehouses. They complement each other and their usage will be dependent on the business requirement. The open source Hadoop that is capable of processing unstructured data will optimize the data warehouse environments and reform the generation of data warehouses. The traditional data warehouses will evolve into analytical warehouses capable of processing structured and unstructured data. Newer data warehouses will be bigger, better and faster than ever before which will transform data into useful information. Real time analytics will be possible as information will be loaded into the data warehouse instantly and go beyond just dashboard and reports to analyze day to day operations. Multi structure formats like XML, JSON will be supported and processing of the data will be offered on the cloud.
The concept of upgrading the old data warehouse will fade away. It will be a living system that will grow seamlessly as per the need of the organizations.


The result of these advancements in technology will be reduced costs of ownership for the data warehouse and increase rate of investment for the company. The data warehouse will be completely transformed and become a dynamic data integration and transformation engine that delivers consistent performance on the cloud.


References


Tuesday, February 3, 2015

Major BI Tools Comparison & Analysis


The magic quadrant for Business Intelligence and Analytics platforms by Gartner shows the relative positions of the market competitors. By examining the quadrant at a high level, Tableau is a clearly the unmatched leader in the market for 2014.

I have chosen the following 5 BI tools for final comparison:

S. No.
Tool Name
Magic Quadrant Position
1
Tableau
Leader
2
Microstrategy
Leader
3
Qlikview
Leader
4
GoodData
Niche Player
5
Logi Analytics
Challenger

Below are the strengths and weakness based on which I have ranked these tools:-

Tableau 
It has been a benchmark in business intelligence software’s for many of its competitors as it is very highly rated by the consumers. It started as a basic tool for data analysts but now has captured the Enterprise market as well.

Strengths
1. Development Interface for the Tableau is extremely user-friendly as it is intuitive and everything to the user needs is just a click away. It’s easy enough that people with basic knowledge of MS Excel can understand it.
2. Visualization of the dashboard requires almost negligible formatting as it is designed based on a lot of scientific research.
3. Enterprise-ready and easy to manage and administer. It is easy to install and gives the user the ability to create interactive and analytical dashboards right from the word go.

Weaknesses
1. Object Management is not offered by Tableau: Versioning of documents is not a feature in Tableau, the user needs to take the backups by themselves, as there is no concept of development and production.
2. Average Sales Experience during the entire sales life cycle: Several customers have categorized Tableau as inflexible and find the 25 percent annual maintenance fee higher than competitor offerings in the market.

Microstrategy

Strengths
1. SQL engine of Microstrategy is very robust and the users just have to submit the dimensional model and the reports can be easily built using drag & drop options.  This is one of the biggest strength of Microstrategy and also one of the reasons for its popularity.
2. Mobile Business Intelligence, the most premium version offered by Microstrategy is a leader in this domain.

Weaknesses
1. Development interface for Microstrategy is complex and time consuming.  Its traditional and resource-intensive environment makes it less user-friendly
2. Development speed is slower as lot of front development is required even for generating the smallest reports.
3. Although the answers provided by this tool are much appreciated, Visualizations of Microstrategy are not too usable. They require external formatting.

Qlikview

Strengths
1. Excellent online support: It has excellent training material, demos and tutorials that attract new customers.
2. Performance of Qlikview is high as it has in-memory processing of data.

Weaknesses
1. Development interface is not logically organized i.e. it has too many tabs in the menu which makes it less user-friendly as compared to its competitors.
2. Although, the Development environment is good but can be problematic for a team working together on the data set. There is no check-in and check-out functionality to handle code versioning and simultaneous development.

GoodData

Strengths
1. End to end solution is provided as platform-as-a-service (PaaS) for Data Warehousing, Data Integration and Analytics.
2. GoodData regularly updates its customer service and reacts to security threats immediately. Their responsive behavior and excellent cloud experience makes it a secure tool.

Weaknesses
1. GoodData BI is mostly used in traditional BI reporting and simpler dashboards. It is not as good as its competitors for performing advanced analytics. Since, they are pretty responsive, they must soon find a solution to tackle this weakness.


Logi Analytics

Strengths
1. Development Interface is intuitive making it very easy for the business users and the developers alike giving an amazing experience.
2. Ease of use and shorter learning curve results in the shortest report development times as compared to its competitors.

Weaknesses
1. It competes with the open-source vendors and has resource limitations due to its relatively smaller size.
2. Global presence and support available for Logi Analytics is limited as compared to its competitors.


Below is the list of criteria that I have chosen to form the comparison matrix:-

1.  Customer Experience
The first criteria I have chosen to assess the 5 chosen vendors is customer experience. This includes the ease of use of the tool as well as how easy it is for the users to be start the analysis. Also, how well the help and support documentation of the tools is made available by the vendors can be considered as an attribute to the overall customer experience.

Tableau is easiest to use out of all the other above-mentioned vendors. It is very intuitive and everything seems a click away: Changing chart types, drilling down, exporting, filtering, and overall navigation are all incredibly straightforward. Microstrategy and Qlikview can be considered at the same level in terms of ease of use and overall experience while GoodData, Logi Analytics can be ranked a little better than aforementioned.

2.  Cost
This is one of the major parameters users consider for finalizing any tool. The below table summarizes the price of license in terms of dollars per user. Also, free trial versions serve as a good practical demo for the users and also gives them look and feel familiarity as enlisted below:

Vendor
Free Trial
Price per user $
Tableau
Yes
500
Microstrategy
Yes
600
Qlikview
No
1395
GoodData
No
500
Logi Analytics
Yes
950

3.  Mobile BI
It defines how well the suite allows customers to deliver BI to mobile devices, such as smartphones and tablet computers. This criteria checks whether there is native platforms support for platforms like Android and iOS. Also, it enables enterprises to deliver analytical content and customize their mobile solution based on client location.

Microstrategy provides an award-winning, industry-leading interface for both iOS and Android. Hence, Microstrategy is a clear winner in a business case where mobility is a requirement. Qlikview also provides good support for mobile BI driving many users towards it. Tableau and GoodData are on the same scale in this field. Logi Analytics provides very basic mobile capabilities and is not considered a good BI tool for mobility.

4.  Data Integration
This means does the tool have native connectors to a wide range of data sources like CSV, SQL databases, Salesforce, Hadoop, Firebird etc.

Tableau integrates well with almost all the data sources. Other vendors also integrate well with many of the popular vendors but not as many as Tableau when it comes to comparison. GoodData requires all of the data to be first moved to the cloud, which can be a limiting factor. But at the same time, GoodData provides its own custom-developed data integration solution by licensing Vertica. Qlikview provides scripting language for integrating and loading the data from multiple sources in memory, it does not provides any advanced ETL capabilities.

5.  Scalability
It refers to the capability of the BI tool to be enlarged to accommodate the growth in terms of handling large volume of data, resource utilization, number of users etc.

Microstrategy supports and offers 64-bit processing. Tableau has excellent rating when it comes to scalability whereas Qlikview has the least rating because there is a RAM limitation to it. Logi Analytics can be considered at the same level. GoodData has a clustered, parallel architecture which makes it as scalable as Tableau.

Comparison Chart


Weight
Tableau
Microstrategy
Qlikview
GoodData
Logi Analytics
1.Customer Experience
100%
10
8
8
9
9
2. Cost per user
80%
10
9
6
9
8
3. Mobile BI
70%
8
10
9
8
7
4. Data Integration
90%
10
9
8
9
8
5. Scalability
100%
10
10
8
10
8
Points
100%
4.26
4.03
3.43
3.99
3.55
Rank

1
2
5
3
4


On the basis of the chosen 5 criteria, a comparison chart is drawn. To sum it up, Tableau emerges as a definite leader in BI tools. Second position goes to Microstrategy. GoodData is a niche player as portrayed by the magic quadrant. In this analysis, it secures a third position by a substantial margin and not far from shifting to the leaders quadrant. Logi Analytics is a good challenger as portrayed by the magic quadrant to the leader Qlikview. By a very close margin, Logi Analytics takes lead over Qlikview to secure the fourth position.

The above rankings are based on the 5 most important criteria’s according to me as an end-user. There is no single parameter which could help us in determining which vendor to use. It’s a combination of lot of parameters, which are prioritized based on the enterprise/business requirements. If there is a dilemma between two or more vendors, free trial versions provided by the vendors can be used as pilot projects to know and understand how the organization and end-users accept the tool and what good a fit it would be for the business as a whole.


References: